Dependency graph of the alpo.ge Proof of the Riemann Hypothesis
The mathematics and its Lean formalization are the work of Levent Alpöge, working with Claude. His note announcing it is alpo.ge/remark.pdf. This page is drawn from the files on the compiled oleans page, which also has the checks run on them.
Every declaration that the final theorem riemannHypothesis uses, directly or
through a chain of other declarations, and which of them use which: 806,982 declarations joined by
8.2 million links. The other 256,458 declarations in the compiled Lean development, about a quarter of it,
are not used by the theorem and are left out of everything on this page. Below: the proof as a network, the
statistics of dependence and use, a navigator for walking it one declaration at a time, and a map by folder.
Made possible by the support of Grant 63750, “Explaining Universal Truths”, from the John Templeton Foundation. Additional support from research funds of the Laboratory for Social Minds and from the Survival and Flourishing Fund.
The proof as a network
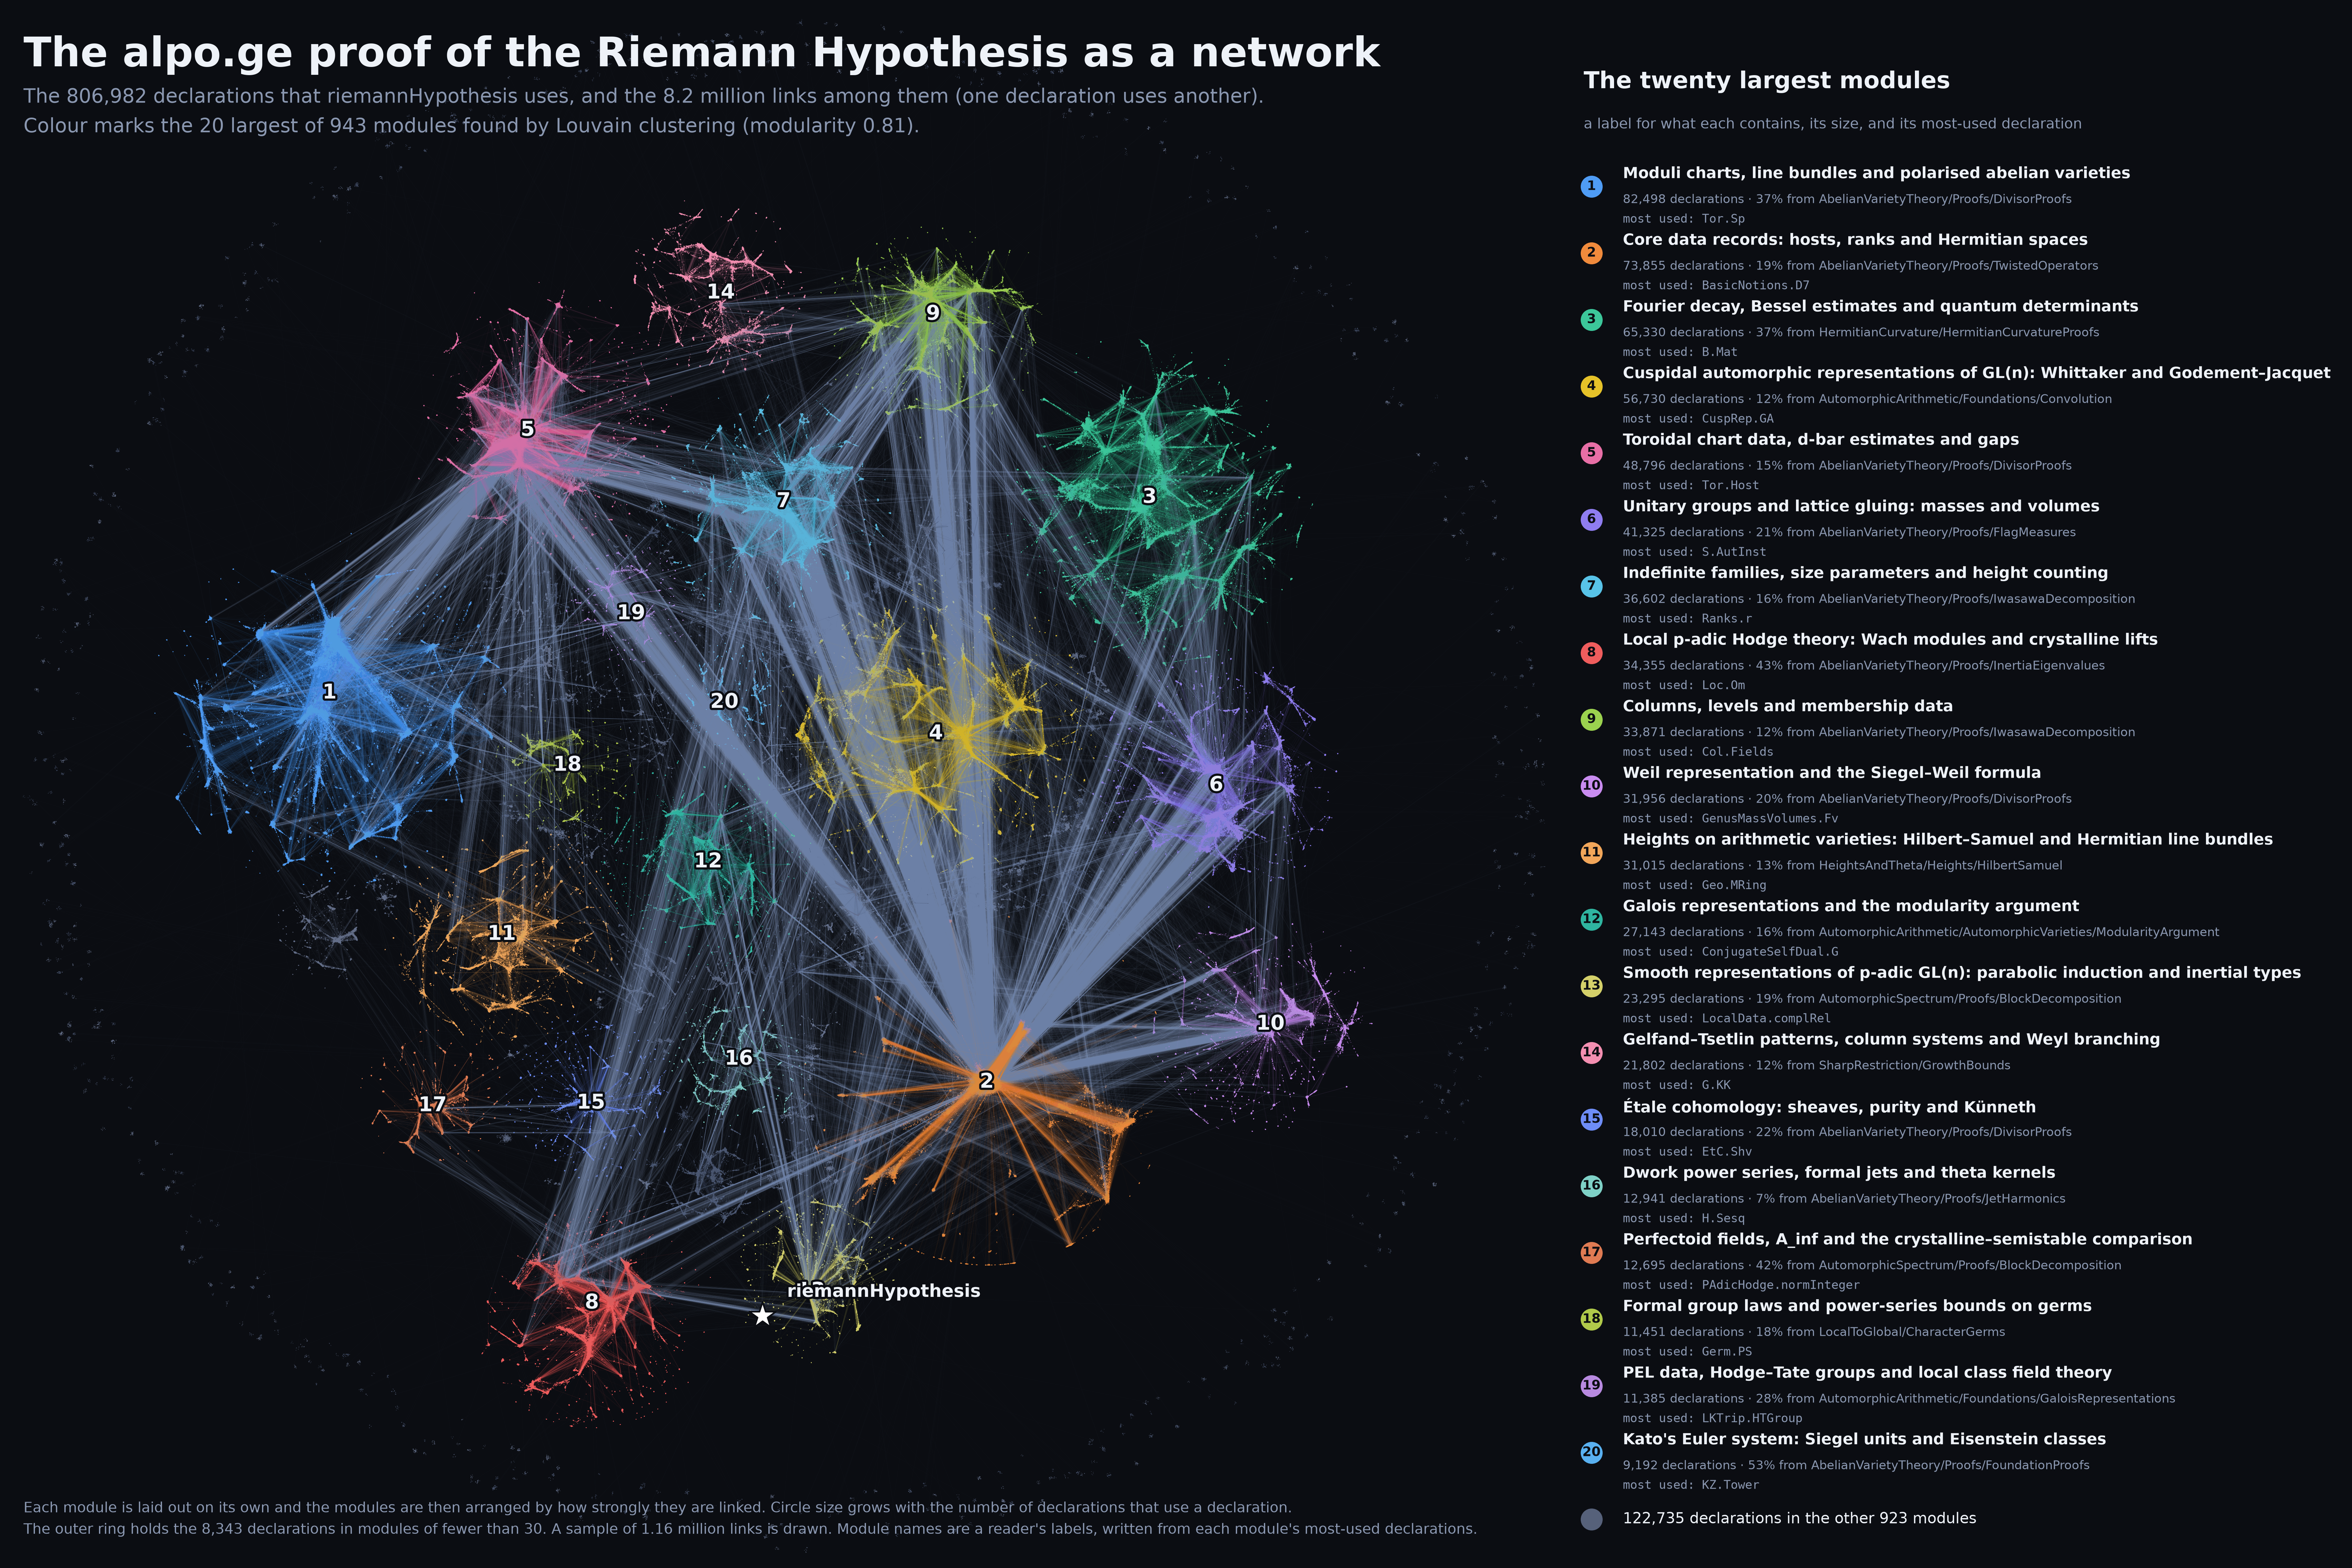
All 806,982 declarations at once. The clusters are the modules that Louvain clustering finds in the links alone, with no knowledge of files or folders: 943 of them, 44 with more than a thousand declarations, at a modularity of 0.81. Hover over a cluster for its name and its most-used declarations; select it to keep them in the box and follow them into the navigator.
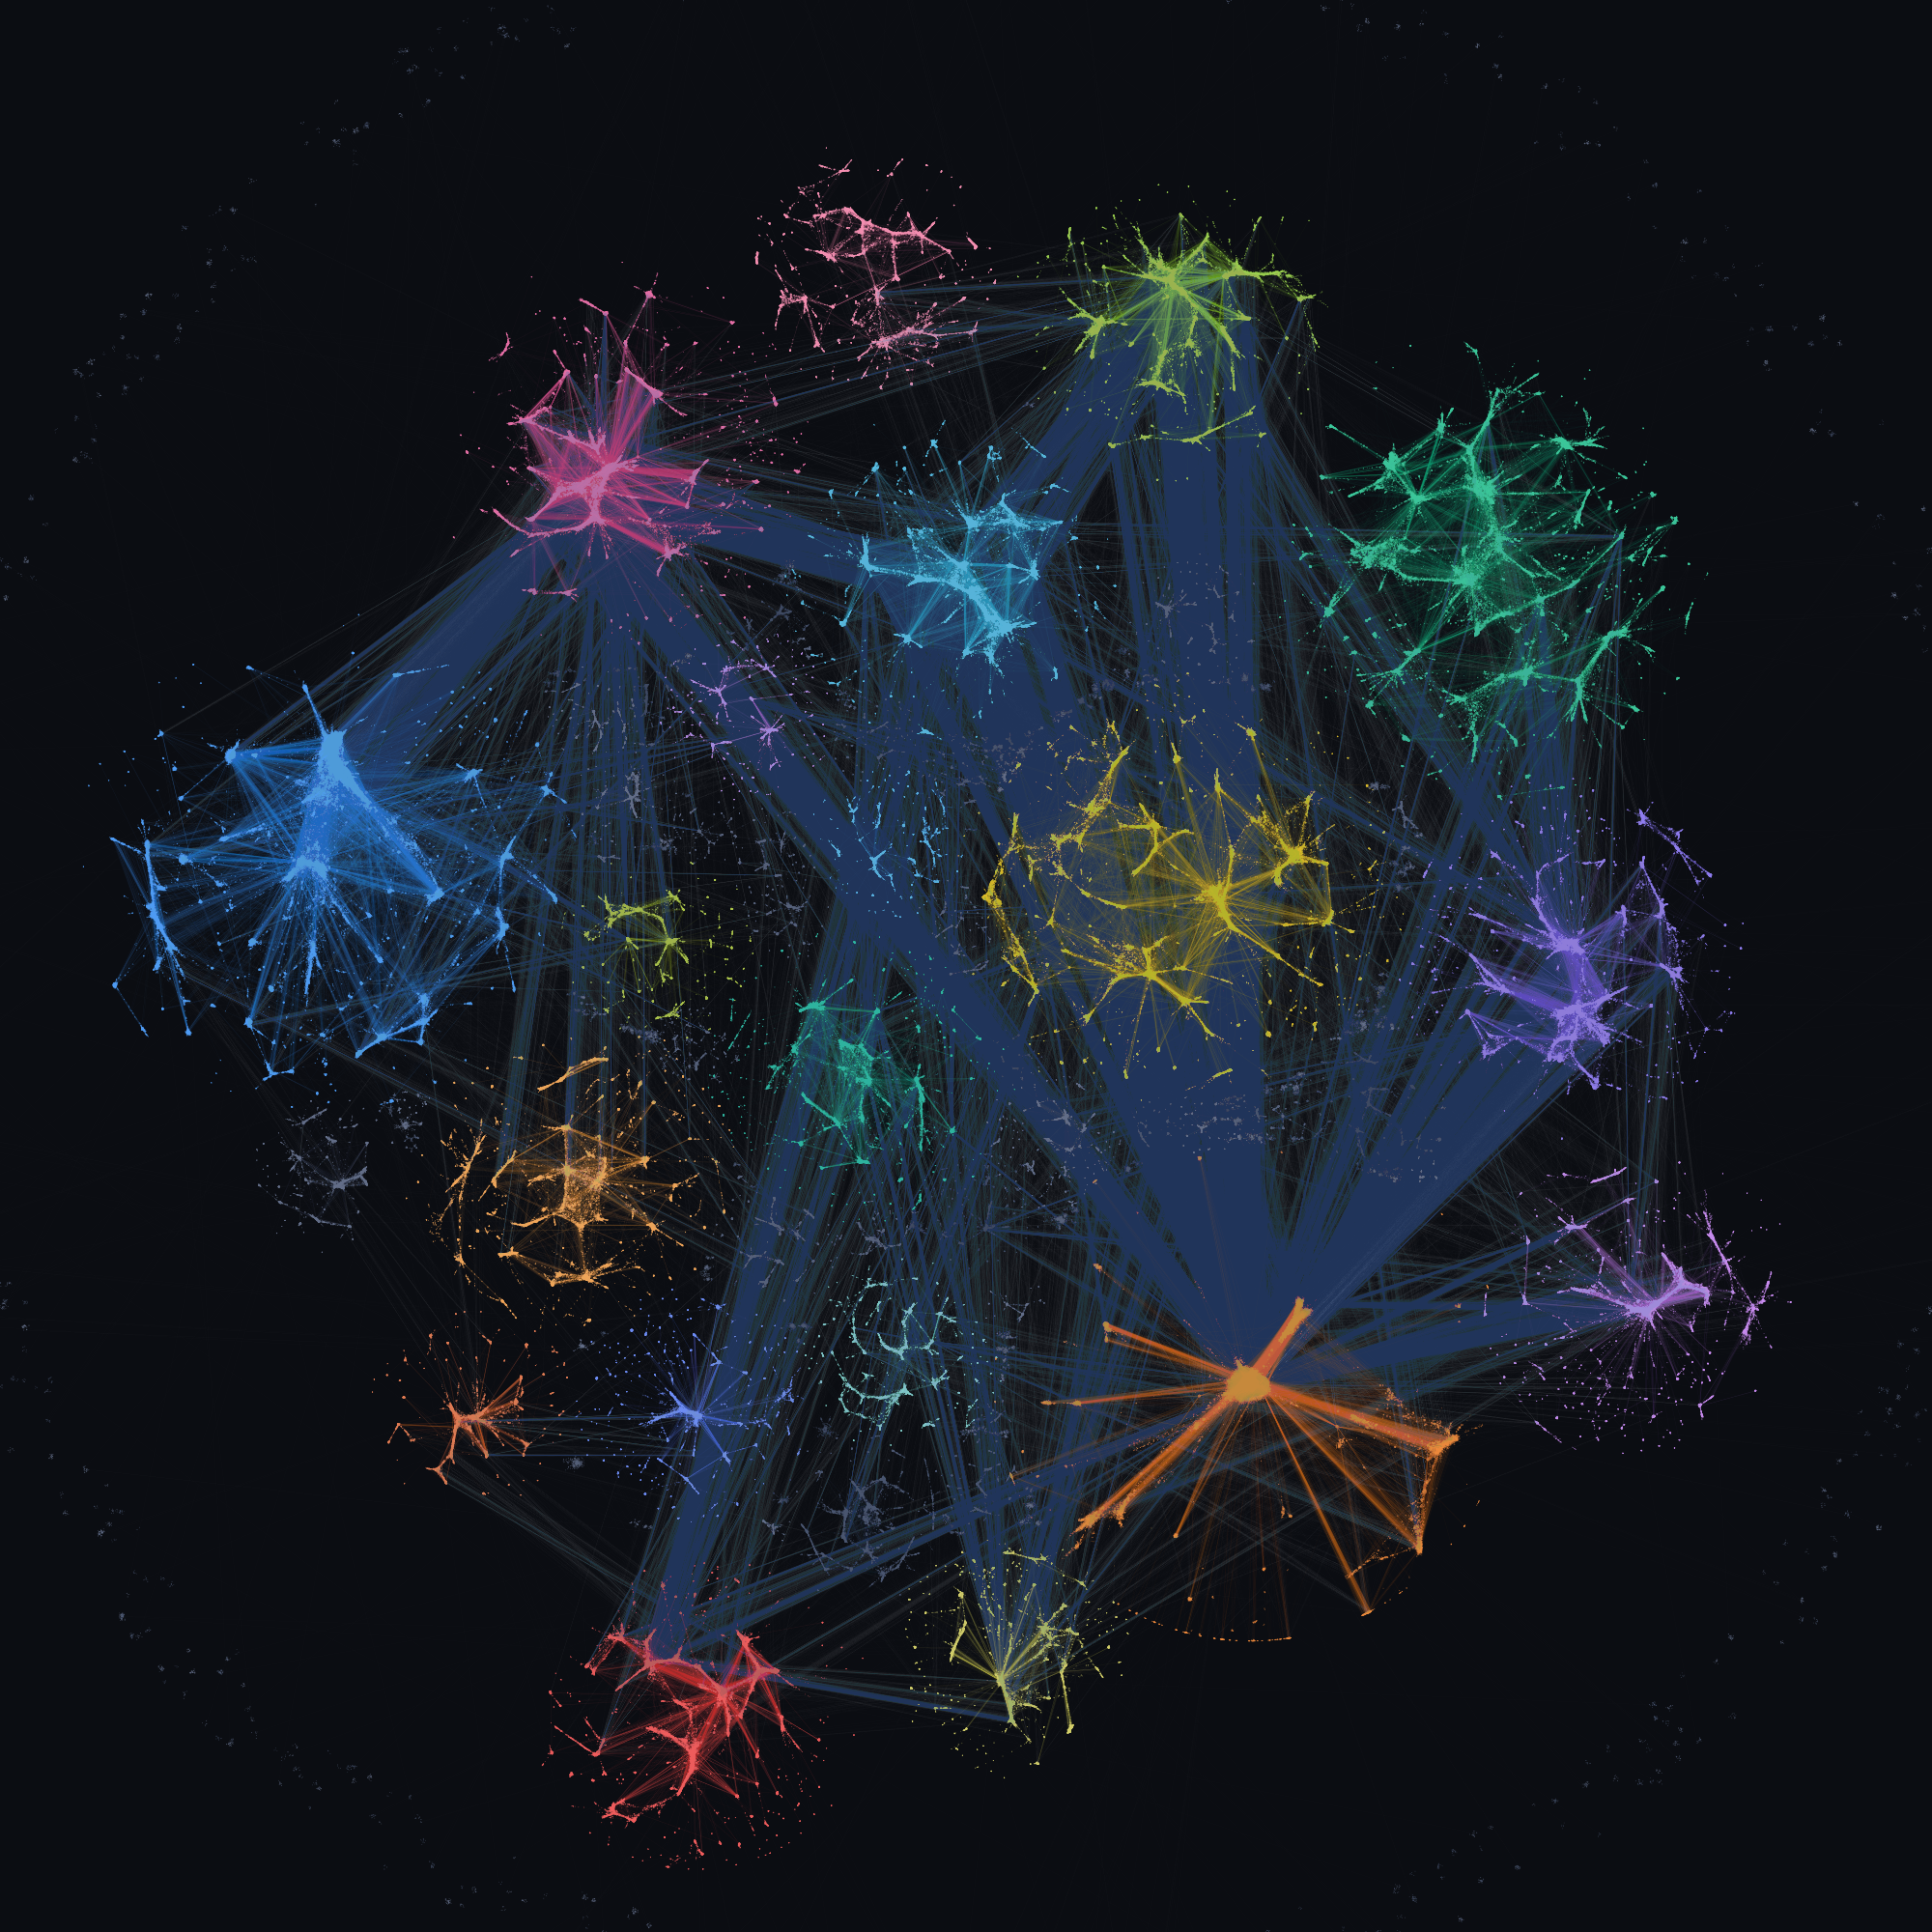
riemannHypothesis.Each module is laid out on its own and the modules are then arranged by how strongly they are linked; the 8,343 declarations in modules of fewer than thirty are left out of this view. The modules cut across the source tree: the largest draws only 37% of its declarations from any one folder. The module names are a reader’s labels, written for the thirty largest from their most-used declarations, namespaces and distinctive name-words; smaller modules are labelled by three of those words. The proof itself does not name them. The picture with a key of the twenty largest modules is a 7200 × 4800 PNG (21 MB).
Dependence and use
Viteri & DeDeo, “Epistemic phase
transitions in mathematical proofs” (Cognition, 2022), count two things for every claim in 48
machine-checked proofs written in Coq: how many claims it depends on, and how many claims use it. Here the same
counts are made on two networks: the top of the proof, the 18,000 declarations within ten steps of
riemannHypothesis (the paper’s convention of stopping at the first depth past 10,000 claims), and
the whole proof, all 806,982 declarations the theorem uses.
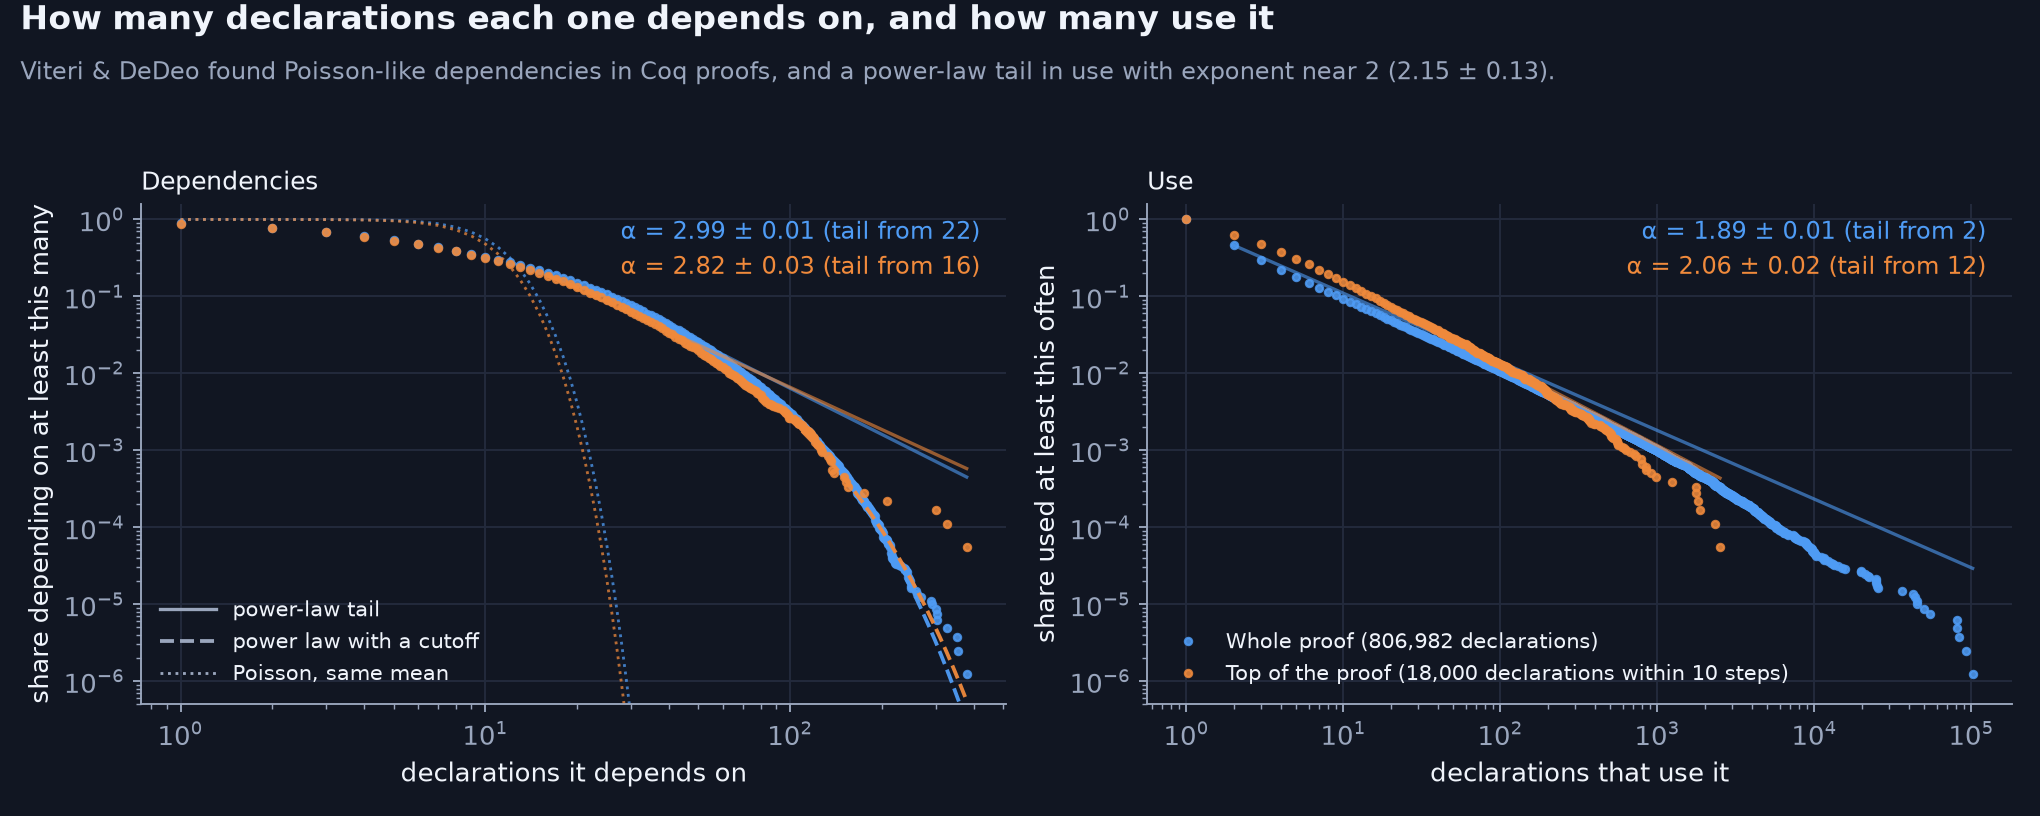
In the paper’s Coq proofs the number of claims a claim depends on is Poisson-like, mostly about three, and the number of claims that use it has a power-law tail with exponent 2.15 ± 0.13. Here the use tail matches: the exponent is 2.06 ± 0.02 for the top of the proof (tail from 12 users, fitted by the method of Clauset, Shalizi and Newman). Over the whole proof the fit gives 1.89, but there a log-normal describes the data better than a power law, so that number should be read loosely. The paper reads an exponent near two as the mark of construction by “tinkering and reuse” (Solé & Valverde, 2019; the copying model of Krapivsky & Redner, 2005), in which a new claim draws not only on an earlier claim but on some of that claim’s own precursors, put to new purposes; the same exponent here is consistent with this Lean proof having been assembled in the way the paper’s Coq proofs were.
Dependence is heavy-tailed too, which the Coq proofs were not. A declaration depends on 9.5 others on average with a variance of 190, where a Poisson would have a variance of 9.5; some depend on several hundred. A power law fitted to the tail has exponent 2.82 ± 0.03 for the top of the proof (from 16 dependencies, the top 21% of declarations) and 2.99 ± 0.01 for the whole proof (from 22, the top 15%). The tail bends below a straight line, though: a power law with an exponential cutoff (exponent 1.8, cutoff near 44 dependencies; 1.5 and 37 for the whole proof) or a log-normal fits significantly better than a pure power law in both networks. The likely reason for the difference from the paper is style and grain. Its networks are built from the individual deductions inside Coq proof terms, each of which draws on a few others. A Lean declaration is a whole lemma or definition, and a long one can draw on dozens or hundreds of earlier ones, so the number of things one declaration draws on varies far more.
The paper’s model of belief, run on this proof: deduction against abduction, and the effect of the prior
The paper models a reader who goes over a proof step by step, revising belief in each claim to agree with the claims it depends on (deduction) and the claims that depend on it (abduction), with some chance of error at every inference.
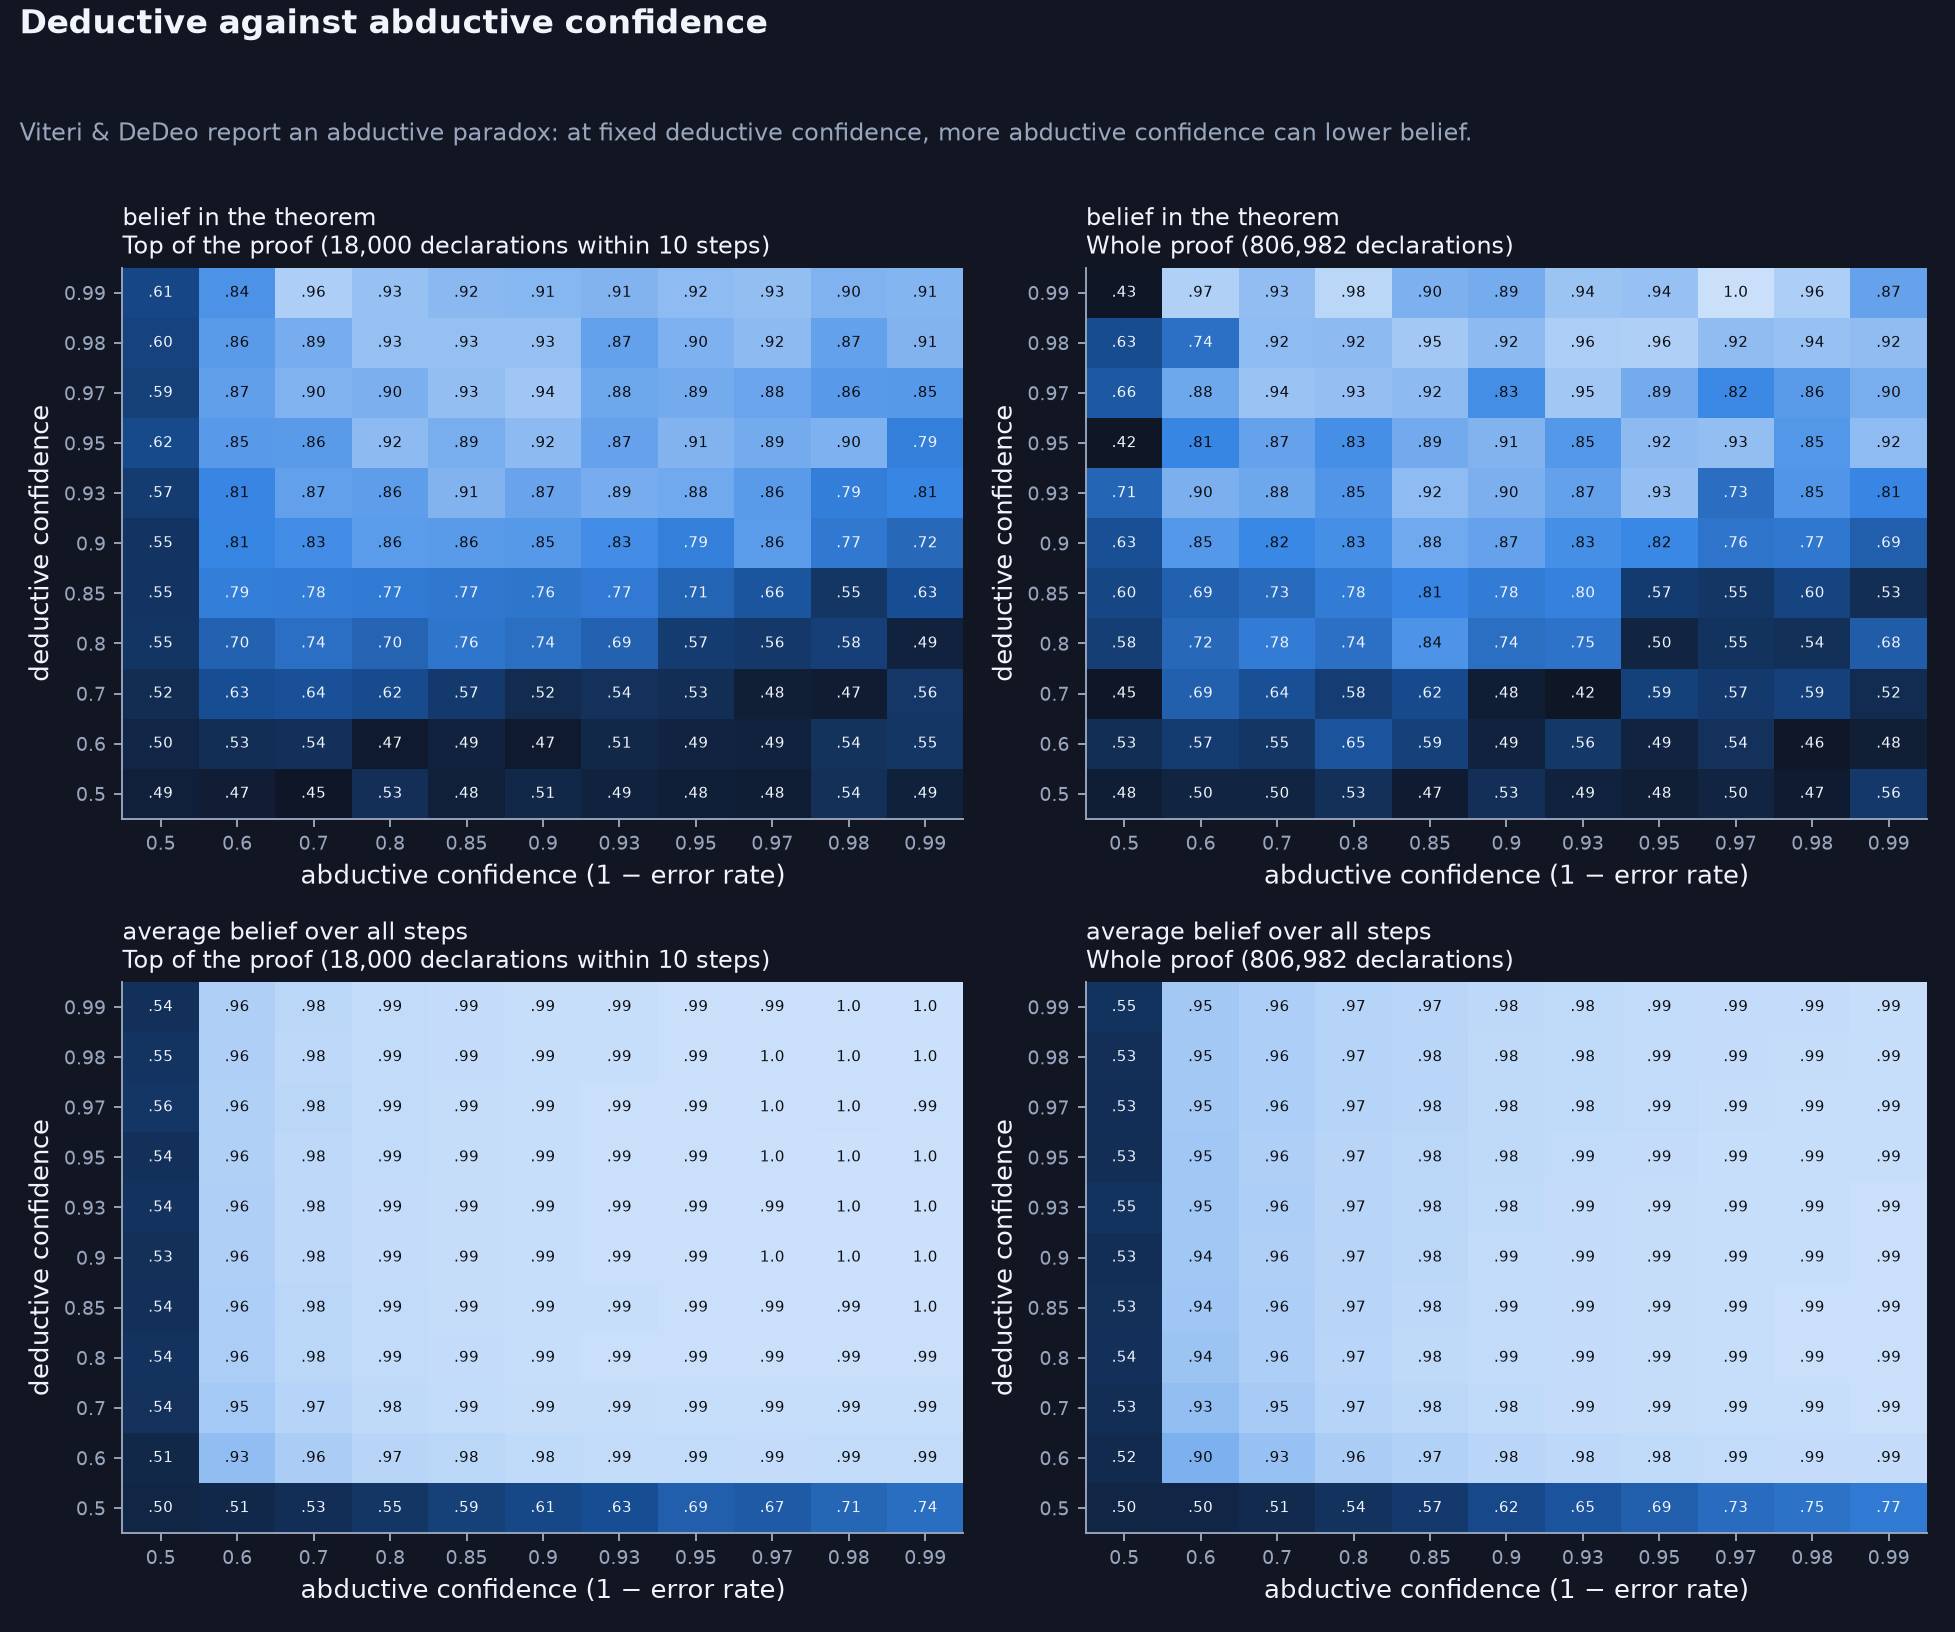
The paper reports an abductive paradox: at fixed deductive confidence, more abductive confidence can lower belief. It shows up here for the theorem. At a deductive confidence of 0.85, belief in it is 0.79 when abductive confidence is 0.6 and about 0.6 when abductive confidence is 0.98 or 0.99. Average belief over all steps shows no such turn.
The paper reports an abductive paradox: at fixed deductive confidence, more abductive confidence can lower belief. It shows up here for the theorem. At a deductive confidence of 0.85, belief in it is 0.79 when abductive confidence is 0.6 and about 0.6 when abductive confidence is 0.98 or 0.99. Average belief over all steps shows no such turn.
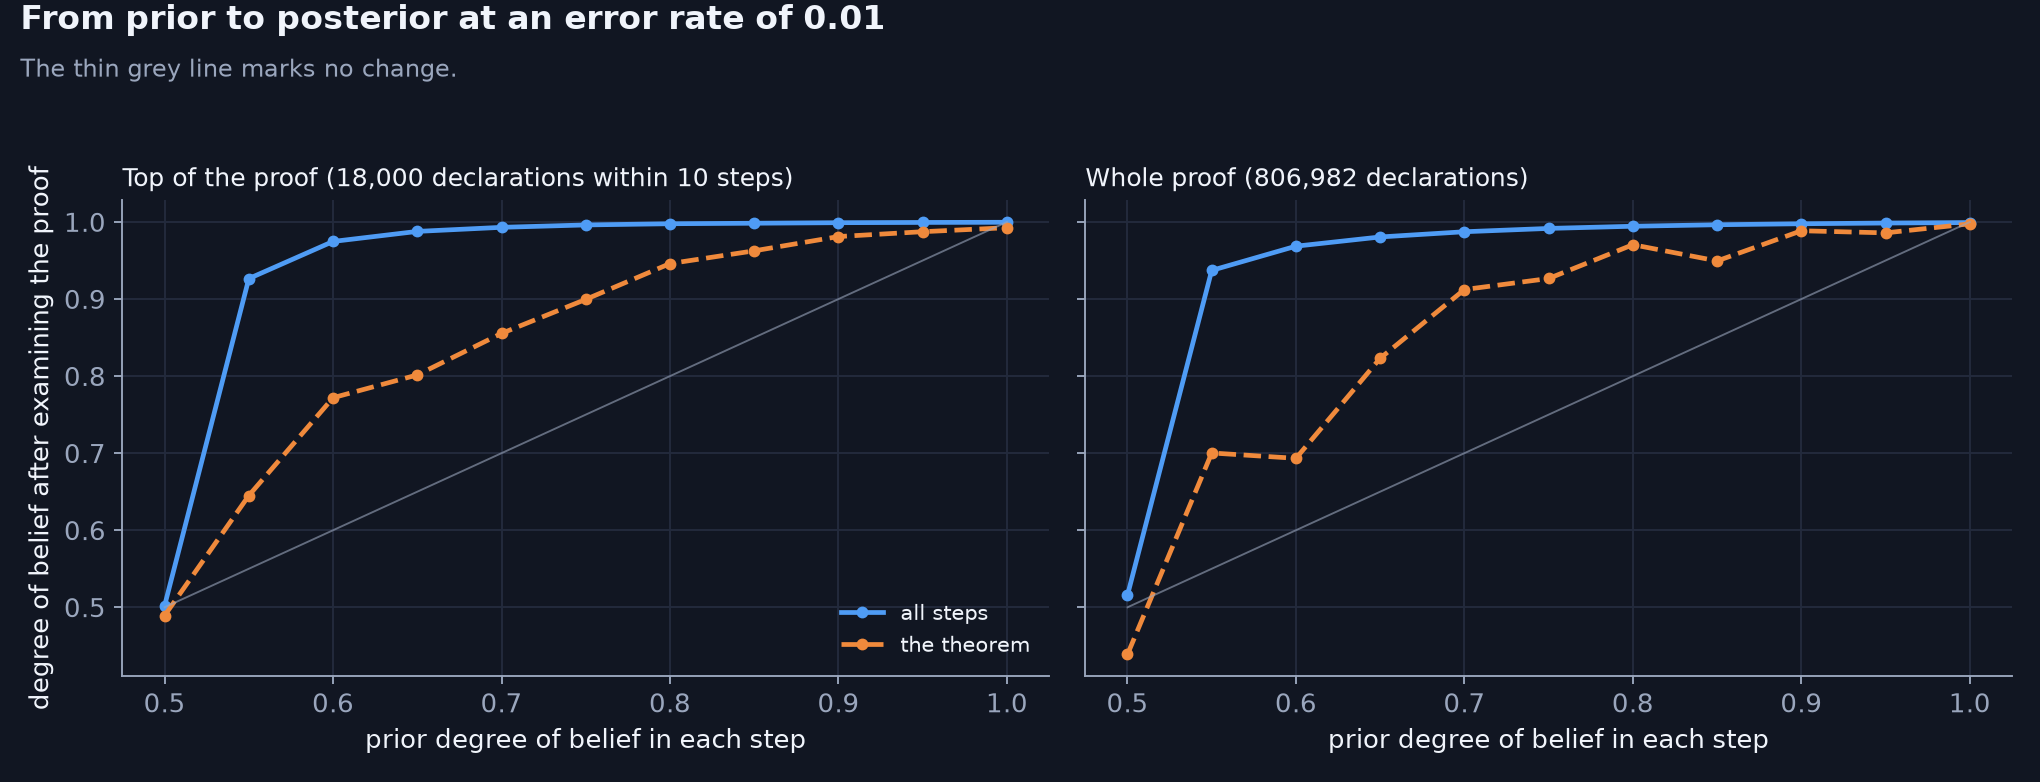
At an error rate of 0.01, a prior of 0.55 in each step is enough to bring average belief above 0.9. Belief in the theorem follows the prior more closely, because the theorem sits at the end of a thin chain: the first four levels of the proof hold one, one, two and three declarations.
Settings, as in the paper unless noted: each step starts true with probability 0.75 where the prior is not varied; the update rule is applied ten times per declaration; belief is the time-average of a declaration’s state, here over the second half of a run, averaged over 128 runs per point in the grids for the top of the proof and 32 for the whole proof (320 and 96 for the prior). This is a model of how belief forms. It says nothing about whether the proof is correct.
Walk the graph from any declaration
Type a declaration’s name, or the end of it, and pick it from the list. The drawing shows what uses it on the left and what it uses on the right, as many steps out as you choose. Select any circle to move there. The box beneath gives its signature, its surprise in bits per token, and the full lists.
Map of the proof, by folder
Each circle is a folder of the source tree, sized by how many declarations it holds. An arrow from A to B means declarations in A use declarations in B, and its width shows how many such uses there are. Folders nearer the top sit closer to the final theorem. Select a circle to read its numbers; open it to see the folders inside.
| Folder | Declarations | Mean steps below the theorem | Bits / token | Uses | Used by |
|---|
The top of the proof, declaration by declaration
The declarations within a few steps of riemannHypothesis, left to right by how many steps away they are.
Show the first levels as a table
| Declaration | Steps below | Kind | Declarations beneath | Direct uses |
|---|
How deep the proof goes
The number of declarations at each distance below riemannHypothesis, counted along the shortest chain of uses, split by top-level library.
Show as a table
The graph as one file
alp-declaration-graph-used-by-rh.json.gz
(57 MB; 450 MB unpacked) holds the 806,982 declarations that riemannHypothesis uses and the
8,197,610 links among them, with each declaration’s surprise. It is one JSON object with
a meta block that documents the fields and a nodes array with one declaration per line:
{"id":19033,"id_in_full_graph":36593,"name":"GlobalTheory.Mem.Top.Bl.anyGeometry","kind":"def",
 "file":"Development/AbelianVarietyTheory/Definitions/AutomorphicMembership/OverIx.lean","line":19,
 "steps_below_riemannHypothesis":8,"tokens":13,"tokens_signature":7,"tokens_alone":13,
 "surprise_bits":54.0,"surprise_bits_signature":38.1,"surprise_bits_body":15.9,"surprise_bits_alone":127.7,
 "uses_in_signature":[19032],"uses_in_body":[596330,597089,623129]}
SHA-256 82c88d25d909a1399c754b87ce298e1939ab0908aeb4766fdac8a57387c71dc5.
The numbers in the two uses lists are ids of other entries.
The surprise fields are totals in bits: surprise_bits sums over the declaration’s tokens, each
scored given the file so far, and surprise_bits_alone is the same declaration scored with no
context. Divide by the matching token count for bits per token. id_in_full_graph is the
declaration’s id in
alp-declaration-graph.json.gz
(71 MB), the graph of the whole development, which also holds the 256,458 declarations the theorem does not
use.
.olean files of all 175,187 modules, so the links are the ones the Lean compiler recorded, including uses
introduced by tactics, instances and notation. A node is a source declaration; compiler-generated helpers, structure
fields and constructors are folded into the declaration that owns them. Uses of Mathlib and core Lean are not drawn.
Only declarations that riemannHypothesis uses are shown, and a count of how many declarations use a
given one counts only those.
Surprise is the mean number of bits per token that a small language model (Kimina-Prover-Distill-0.6B) needs to
predict a declaration’s text given the file so far. A link says that one declaration mentions another. It does not
say the mention carries mathematical weight, and nothing on this page checks the proof.